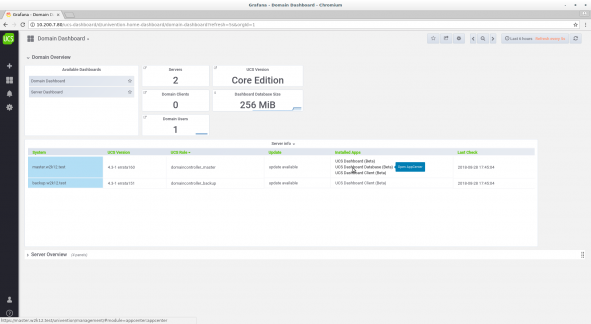
In the UCS Dashboard app, we now have the first (beta) version of a new dashboard based on the Open Source solutions Grafana® and Prometheus. The app allows administrators to check the status of domains and individual servers on different dashboards quickly and simply. The dashboards can be accessed simply via a web browser, access a database in the background, and deliver updated reports on certain aspects of the domain or servers continually.
The app is made up of three components:
- UCS Dashboard for the visualization of data from the central database (Grafana®)
- UCS Dashboard Database, a time series database for the storage of the metrics (Prometheus as a time series database)
- UCS Dashboard Client for the provision of server system metrics (Prometheus node exporter)
Monitoring and Analysis of UCS Domains and Servers at a Glance
We want to offer administrators of larger environments in particular support in their administrative work with the new dashboard. For example, the boards will show when updates are available for different servers in the environment and what recent important changes there have been in the domain (e.g., different memory utilization). This information provides administrators with a rapid overview of the current status of the domains for which they are responsible, allows them to identify potential sources of errors in good time, and permits them to analyze their IT environments with the aim of rendering them more efficient.
The UCS Dashboard app can be installed from the Univention App Center and set up with just a few clicks of the mouse. A preconfigured mounting option for the web interface to UCS’ central identity management (IDM) system and a collection of standard dashboards optimized for UCS metrics make getting started particularly simple. Further servers can also be integrated via the installation of the UCS Dashboard Client app on the desired system without any further configuration requirements.
Tried-and-Tested Open Source Technology – Grafana® and Prometheus
Grafana®, a popular monitoring tool among administrators, ensures the clear, web-based visualization of the system information in the form of customizable dashboards.
Prometheus is used for data collection. The Prometheus node exporter regularly collects metrics about the status of the system and makes them available in a simple text format via HTTPS.
The Prometheus database continually requests data from all known systems and saves them as a time series. The database itself can be queried using a special language (PromQL). This is then the task of the Grafana® web interface. Even complex queries can be visualized simply via a set of preconfigured widgets (panels) and their configuration.
All of the necessary components are automatically installed on the target system during installation of the UCS Dashboard app. All that is required to start monitoring additional systems is to install the UCS Dashboard Client app on them.
Simple Expansion Thanks to Standardized Prometheus Node Exporter
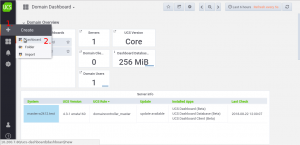
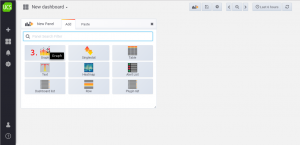
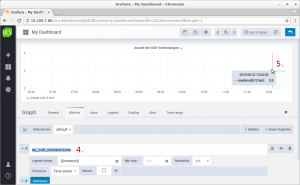
The Prometheus node exporter and the Grafana® web interface can be expanded as required. In this way, for example, additional metrics can be collected and provided on clients. These data can also be simply visualized using individual dashboards in Grafana®. The principle can be illustrated by the following example:
We want an overview of the number of SSH connections on a server.
First, a script is required on the system (on which the UCS Dashboard Client is installed) to collect the desired data.
-> more /usr/local/bin/ssh_conections

#!/bin/bash

DEST="/var/lib/prometheus/node-exporter/my-ssh-connections.prom"
METRIC_NAME="my_ssh_connections"
ssh_connections="$(LC_ALL=C netstat -tnpa| grep -i "ESTABLISHED.*sshd" | wc -l)"

# make this a atomar operation to not confuse the node client with file fragments
echo "$METRIC_NAME $ssh_connections" > "$DEST".$$
mv "$DEST".$$ "$DEST"
Additionally, the data are saved in a special format “Name_of_metric_value” in a file in the
"/var/lib/prometheus/node-exporter/"
directory. In addition to the standard metrics collected by the node exporter, all text files in the directory above are also searched for metrics and additionally offered.
A cron job ensures the regular updating of the data on the system.
The Prometheus database always collects all the data offered up by the client, so there is no further action required.


This rudimentary example obviously only shows a fraction of the overall possibilities. Further documentation on the Prometheus node exporter and Grafana® web interface can be found on GITHUB at: https://github.com/prometheus/node_exporter and at http://docs.grafana.org/.
Productive Version of UCS Dashboard App Planned for This Fall
We have decided to release the UCS Dashboard app as a beta version first of all in order to gauge the interest in this kind of application. We would really appreciate your feedback, particularly with regard to the information on your UCS environment displayed on the dashboard. Please give it via the comment field here on this page or via our product feedback form.
If considerable interest is shown in UCS Dashboard, we plan to release an official version of the app for productive use this fall. If possible, we also intend to integrate the user feedback received by that point along with additional desirable features suggested by UCS users. This final version will likely only be made available to customers with an Enterprise subscription.


Comments
Diogo Serra
Hello I would like to try
Alice Horstmann
Hi Diogo,
Great that you would like to test the new UCS Dashboard! If you don’t use UCS, yet, you could download it for free as UCS Core Edition from our download area:
https://www.univention.com/downloads/download-ucs/
Afterwards – or if you already operate a UCS system – you find the UCS Dashboard App in the Univention App Center from where you can install it in your UCS environment.
We are looking forward to your feedback here in the blog or via fedback@univention.com/
If you have any technical questions, please post them in our user forum help:
https://help.univention.com/
Regards
Alice
Diogo Serra
Sorry for the late reply.. but i don’t get notified..
I’m be using the dashboard, one thing that i think can be improved is the update /no update column, having only the NO can pass without been noticed, so put some color when have updates would be great
Felix Botner
Hi,
yes, that’s a good idea, i have added this to the “list of ideas” and i think this should be easy to implement as grafana already supports this.
Best regards,
Felix
Eric Browning
I was able to install the server portion of on on my primary AD node, but on my replicated/backup AD node I couldn’t install the client. Do I need to install the server again on this node? It gives an error about not being able to reach the app center server which is silly because I update this server when I update all of the others.
Full Error: The requested action cannot be carried out. Please consider the information listed below in order to resolve the problem and try again.
The server tried to connect to the involved systems. The following hosts cannot be reached or do not have access to the App Center server:
ad1
The following software changes on ad1 will be applied: an unknown amount of packages will be installed / upgraded, an unknown amount of packages will be removed, an unknown amount of packages are erroneous
Felix Botner
Hi,
no, the server (and database) components need to be installed only once in the domain. On all other systems only the client App (in theory).
Seems that there is a problem with the AppCenter on ad1 ( i assume you started the installation of the app on ad1 from the UMC AppCenter on you primary AD node).
Can you see/install Apps in the UMC AppCenter on ad1 directly (
https://ad1-> UMC Management -> AppCenter)?Are there error message in /var/log/univention/appcenter.log on ad1?
Is the cmdline tool “univention-app update” on ad1 working?
Best regards,
Felix
Allen Sampsell
Looks like a great product I’d like to test and use but under the License could you explain “Liable to Costs with Free Trial”? Is it Free for non commercial use? Or is there a cost model etc?
Felix Botner
Hi,
we are considering to allow the App only together with a base subscription. Other than that there will be no restriction.
Best regards,
Felix
Ardit M
I installed this but can’t login to the UCS dashboard using the UCS administrator login and password. I get “Error while trying to authenticate user”.
Alice Horstmann
Hi,
I think it would be the best way if you describe your problem as detailed as possible at: https://help.univention.com/
I’m sure that someone from our engineers or another user can help you with it.
Best,
Alice