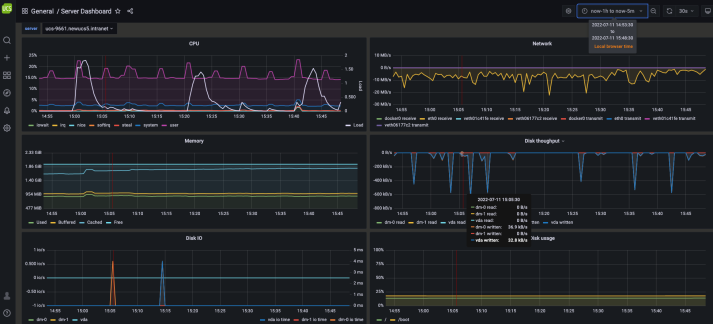
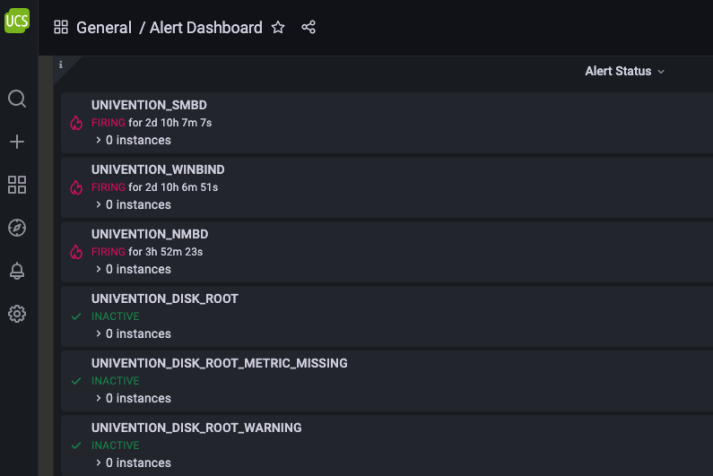
Detailed domain and server monitoring for important Key Performance Indicators (KPIs) such as disk usage, memory, CPU, network, etc. is an indispensable part of ensuring the smooth, trouble-free operation of an UCS environment. Using the UCS Dashboard, administrators can quickly obtain an overview of the status of a UCS domain and its servers via different dashboards.
Our development department just recently released a new version of the dashboard for UCS. One major innovation: The Alertmanager replaces the previously used tool Nagios. In this article, I would like to give you a brief overview of the dashboard features and introduce you to the new Alertmanager.
Table of Contents
Parameter “Disk usage” prevents System crashes
A parameter you should keep an eye on in the server dashboard is for example the “Disk usage” value. If the hard disk is full, the UCS system would stop or, in the worst case, crash. To prevent such or other disturbing factors, the administrator can use the dashboard to quickly gain an overview of the most important parameters of the UCS system and thus ensure smooth, trouble-free operation.
Grafana and Prometheus – Technical Basis of the UCS Dashboard
The UCS Dashboard app is now available for UCS 5.0. It is based on the open source solutions Grafana and Prometheus including Node Exporter and collects the data from individual systems in a central database.
The dashboard consists of (the) four components:
- UCS Dashboard for visualizing data from the central database (Grafana)
- UCS Dashboard Database, a time series database (TSD) for storing metrics (Prometheus as a TSD)
- UCS Dashboard Client for providing metrics from server systems (Prometheus Node Exporter)
- Prometheus Alertmanager (notification function for the UCS Dashboard)
The latest updates of the apps for UCS listed above deployed the most recent versions of Prometheus, Node Exporter and Grafana. For example, the Node Exporter integrated into the Dashboard now also uses the new naming convention (metric name) as well as its contents.
UCS 5 Dashboard Innovations
In comparison to UCS 4, the Alertmanager has been integrated directly into Prometheus / Grafana in UCS 5.0-2. As a result, all important KPIs such as alarms are now stored in Prometheus and displayed in a separate dashboard in Grafana. You can still configure the alarms via Univention Directory Manager (UDM) as usual. Grafana innately offers three preconfigured dashboards which cannot be modified: Domain Dashboard, Server Dashboard and Alert Dashboard. However, you have the option to configure your own dashboards that meet your requirements. For example, the following parameters can be added to a dashboard: “Server Info”, “NFS Status”, “Join Status” or “nmbd running”.
The newly added app “Prometheus Alertmanager” now allows you to forward alerts to different email addresses, which you can configure while installing the app. We stopped the support for the server component Nagios for UCS 5.0. Its functionality to inform about disturbances is now carried out by the Alertmanager integrated into Prometheus and Grafana.
For further information please have a look at our documentation.


