The UCS Dashboard provides domain and detailed server monitoring. It is composed of three modules: a webinterface, a database and a client. The webinterface is based on Grafana® and the database and the client is based on "Prometheus".
The Webinterface for analytics and monitoring allows you to query, visualize, alert on and understand your metrics no matter where they are stored. It gives you at a glance a comprehensive overview of crucial elements of your it environment.
The UCS Dashboard App configures:
- Domain Authentication (LDAP) for the Grafana Webinterface
- Datasources
- Default dashboards
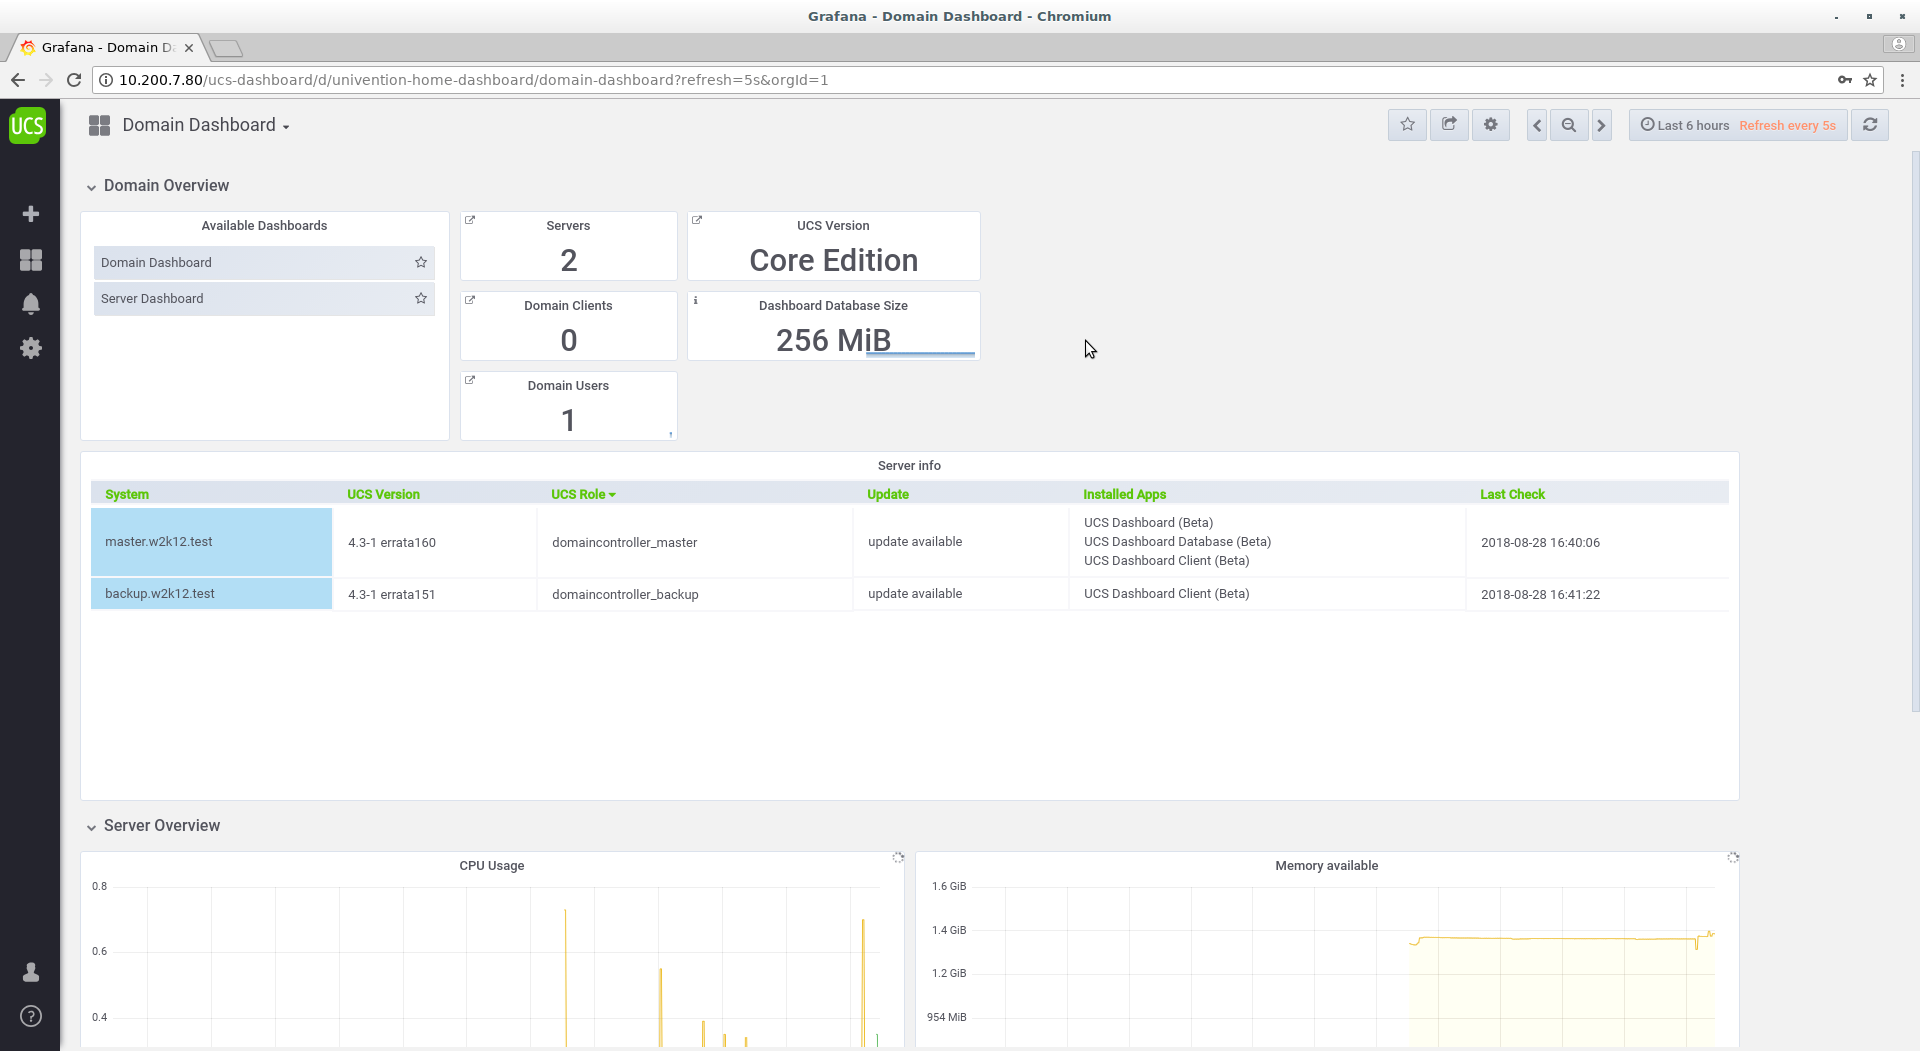
The App comes with three pre-configured dashboards, a "domain" dashboard with:
- Overview of the number of users, servers and clients in the UCS domain
- UCS specific metrics for all servers such as "Upgradeable Apps", "UCS Version", "UCS Update available"
- Time series graphs for important metrics like "Free Memory" or "Free Disk Space" for all servers
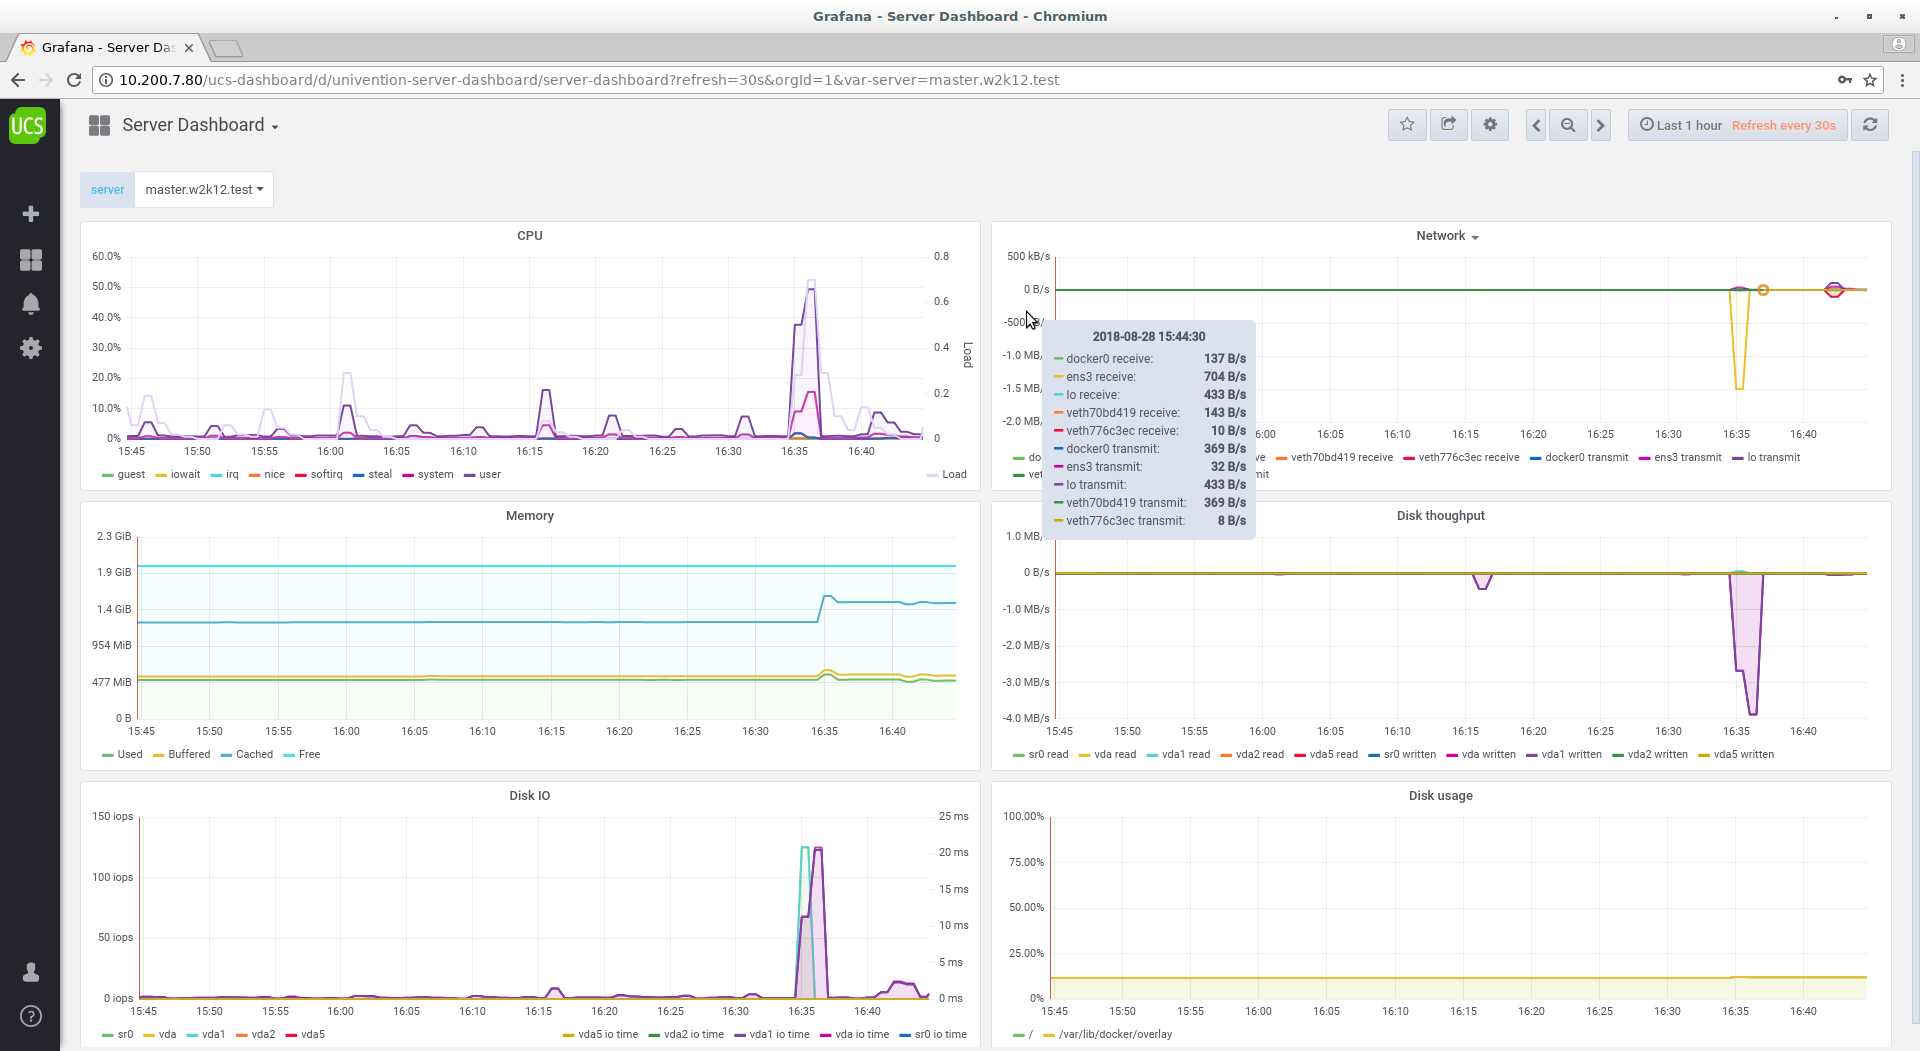
a Dashboard for detailed metrics about a particular server with info's like:
- Disk throughput
- Network status
- Disk I/O
and a Dashboard for a list of all configured alerts.
Individual dashboards can easily be created and configured within the Grafana Webinterface.
The App UCS Dashboad automatically installs the Webinterface, the UCS Dashboard Database and the UCS Dashboard Client App's. The "UCS Dashboard Client" App needs to be installed on all UCS servers which should be available in the "UCS Dashboard" App.
The Grafana Labs Marks are trademarks of Grafana Labs, and are used with Grafana Labs’ permission. We are not affiliated with, endorsed or sponsored by Grafana Labs or its affiliates.
Complementary Apps