UCS Dashboard: Quick Overview of the State of UCS Domains

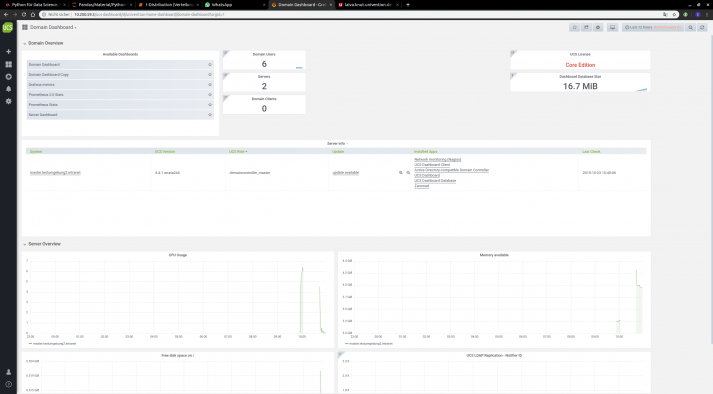
With the UCS Dashboard, administrators can quickly gain an overview of the state of a UCS domain and its servers via different dashboards.
The UCS Dashboard app is based on the Open Source solutions Grafana® and Prometheus and consists of the following three components:

  • UCS Dashboard for the visualization of data from the central database (Grafana®)
  • UCS Dashboard Database, a time series database for storing metrics (Prometheus as time series database)
  • UCS Dashboard Client for providing server system metrics (Prometheus Node-Exporter)
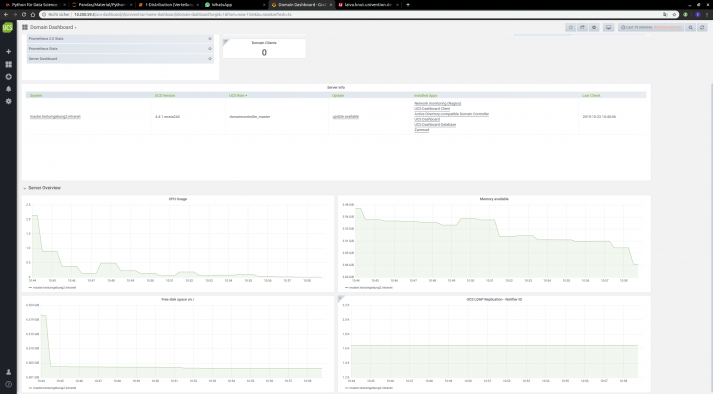
Screenshot UCS Dashboard

Quick Overview Thanks to Pre-configured Standard Dashboards

The connection to the central identity management of UCS and a collection of standard dashboards optimized for UCS metrics are preconfigured and accessible via web browser. The UCS dashboard accesses a database in the background and provides administrators with continuously updated reports on specific aspects of the domain or server. This allows administrators to keep track of the current state of the managed domains to analyze the IT environment and identify potential sources of error early on.
New servers can be connected to the desired systems without further configuration by installing the UCS Dashboard Client App.

Alarm notification in case of critical operating status

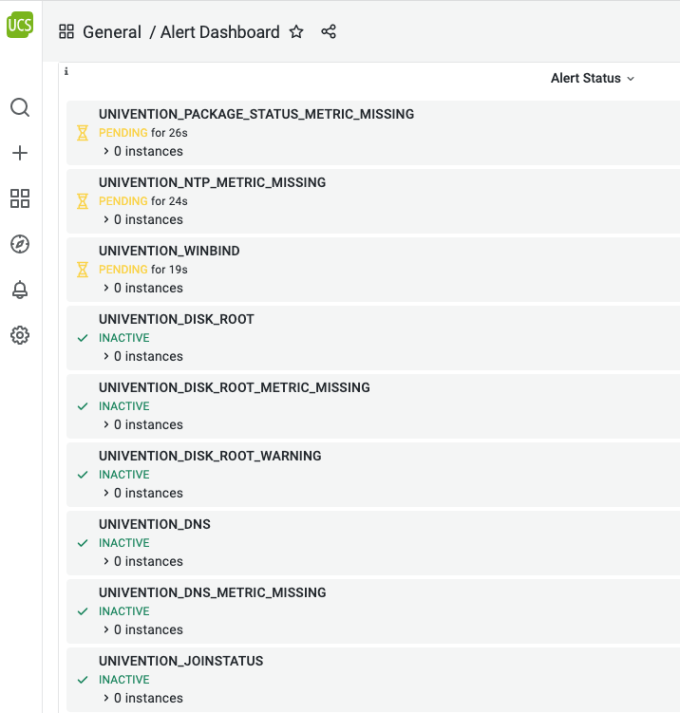
In addition to the standard metrics included in the Prometheus Node Exporter the monitoring provides UCS-specific alerts (alarms) that also monitor among other things listener/notifier replication.

If it operating status changes, monitoring informs a predefined contact person of the possible fault. In addition to reactive notification in the event of a fault, administrators can call up the current status in the Grafana UCS Dashboard web interface at any time and display the status information in a compact form.

Alertmanager Prometheus Univention
Download UCS now